Growth is one of the most visible signs of a child’s overall health and development. From birth through adolescence, monitoring physical growth helps paediatricians detect early signs of medical conditions, nutritional deficiencies, or developmental concerns. At the heart of this process lies a simple but essential tool: the growth chart.
Traditionally, growth charts were printed documents, manually filled in with measurements and plotted by hand. However, as clinical demands grow and data accuracy becomes increasingly important, digital tools like iGROW, developed by Harlow Solutions, are improving the way healthcare professionals use growth charts in paediatrics.
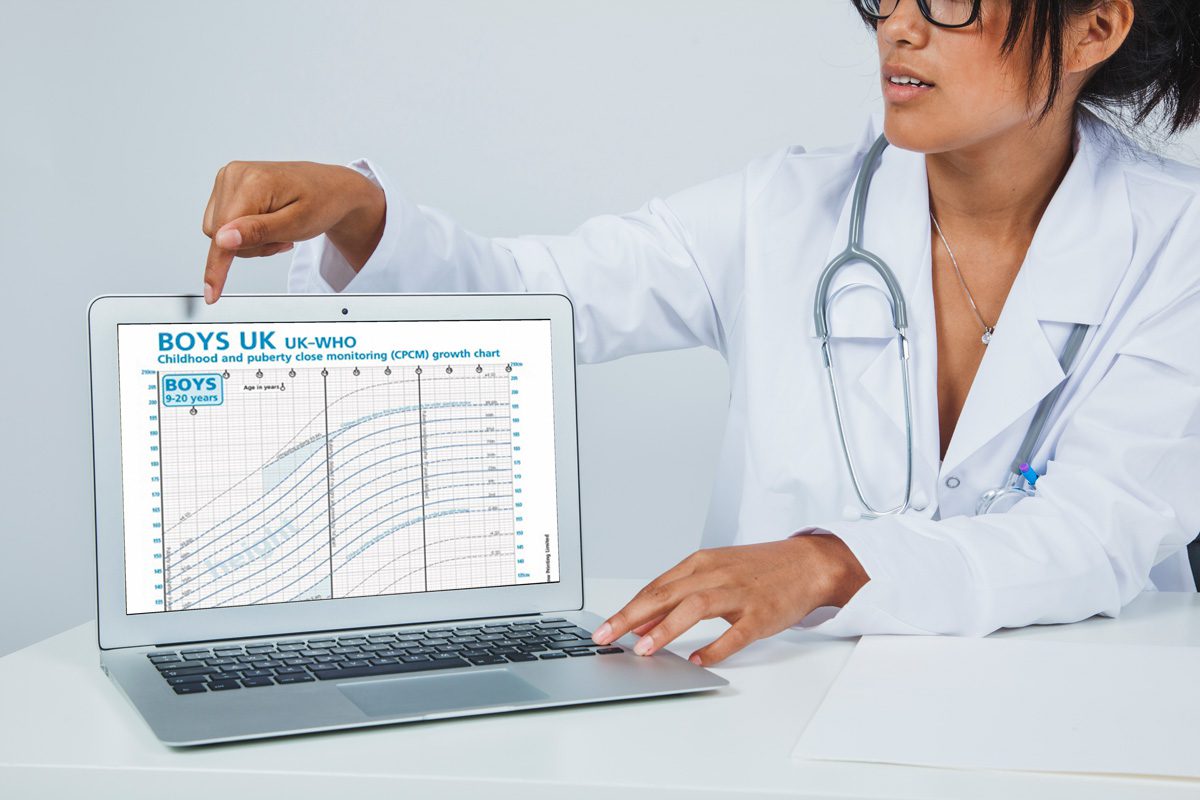
What is a Growth Chart?
A growth chart is a visual tool used to assess and compare a child’s growth over time against standardised reference data. These charts track metrics such as height (length), weight, body mass index (BMI), and head circumference. Clinicians use this information to monitor a child’s growth trajectory and to detect patterns that might signal underlying health conditions.
Growth charts aren’t just about numbers. They offer critical insights into a child’s well-being, development, and environment. When growth appears normal, it is a good indication that a child is healthy. When patterns deviate from the norm, further investigation may be warranted.
Why Are Growth Charts So Important in Paediatrics?
1. Early Detection of Health Issues
Growth delays or abnormalities are often among the first indicators of health problems in children. Poor weight gain, stunted height, or a sharp change in a child’s growth curve may point to underlying conditions such as:
- Malnutrition
- Hormonal disorders (e.g. growth hormone deficiency, hypothyroidism)
- Chronic illnesses (e.g. coeliac disease, kidney disease)
- Genetic syndromes
- Neurological or feeding difficulties
Early detection through accurate charting enables clinicians to intervene before issues escalate, improving outcomes through timely treatment or referral.
2. Monitoring Premature or At-Risk Infants
Babies born prematurely or with low birth weights require adjusted growth assessments. Specialised growth charts and gestational age corrections are necessary to ensure their development is measured against appropriate standards. Tools like iGROW incorporate these adjustments, making growth tracking more precise and clinically relevant.
3. Assessing Obesity and Underweight Trends
With increasing rates of childhood obesity, tracking BMI using growth charts has become an essential part of routine healthcare. Identifying children who are above or below healthy weight thresholds supports early education, dietary intervention, and family-based care plans.
4. Longitudinal Monitoring
A one-off measurement may not tell the full story. Growth charts allow for a longitudinal view of development, helping healthcare providers see whether a child is growing steadily over time or if a pattern of concern is emerging.
5. Communicating with Families
Growth charts also serve as effective communication tools with parents and caregivers. Showing growth visually helps families understand their child’s progress, and gives them confidence in the care they are receiving—or highlights when further support is needed.
iGROW by Harlow Solutions – A Smarter Way to Chart Growth
Designed to complement traditional paper-based charts, Harlow Solutions developed iGROW—a completely digital, paperless growth chart plotting system now adopted by over 30 NHS Trusts across the UK.
What Makes iGROW Different?
- Built on UK Growth Standards
iGROW uses the official UK-WHO growth reference charts and includes templates for specialised populations, such as children with Down Syndrome or Turner Syndrome. This ensures that every child is measured against appropriate clinical standards. - Multi-Metric Tracking
The system tracks height, weight, BMI, and head circumference from birth up to 20 years of age. It supports gestational correction, bone age plotting, and additional health markers. - Integration with EPR Systems
iGROW integrates with major NHS electronic patient record (EPR) systems including EMIS, Cerner, Lorenzo, and Trakcare—eliminating duplicate data entry and reducing time spent on admin. - Customisable Fields for Local Services
With 10 editable fields, Trusts can tailor the system to capture important local data such as breastfeeding status, parental heights, or school attended. - Auditable, Secure, and Scalable
Each entry is traceable to the user who created or edited it. This accountability is essential in today’s data governance climate and aligns with NHS standards.
The Role of Digital Growth Charts in Modern Paediatrics
The digitisation of growth charts represents a major advancement in paediatric healthcare. Here’s why:
- Accuracy: Automated plotting reduces the risk of error.
- Accessibility: Clinicians across departments can view and update charts in real time.
- Efficiency: Reduced paperwork means more time for patient care.
- Data Insights: With exportable data, healthcare teams can conduct audits, spot service-wide trends, and support research.
- Better Outcomes: When potential problems are flagged early, treatment starts sooner—improving health and reducing costs.
Conclusion
Growth charts are not simply tools for recording numbers—they are important in the care and development of children. By using digital charting systems like iGROW, child health clinicians gain a smarter, faster, and more accurate way to track development. With better tools come better decisions—and better health outcomes for children across the UK.To find out more or to request a demonstration of iGROW, visit igrow.software or contact info@igrow.software